A daily look at the race to the 2011 Calder Cup Playoffs. The 2010-11 regular season ends on Sunday, April 10.
Standings through games of Sat., Apr. 2:
| ATLANTIC | GP | W | L | OTL | SOL | PTS | GF | GA | Pct | SOW | ROW | Max Pts | Max ROW | HR | AR | |
| x-Portland | 74 | 44 | 22 | 6 | 2 | 96 | 262 | 219 | .649 | 7 | 37 | 108 | 43 | 2 | 4 | |
| x-Manchester | 77 | 43 | 25 | 3 | 6 | 95 | 244 | 199 | .617 | 1 | 42 | 101 | 45 | 1 | 2 | |
| Connecticut | 76 | 38 | 30 | 2 | 6 | 84 | 207 | 210 | .553 | 5 | 33 | 92 | 37 | 3 | 1 | |
| Worcester | 76 | 35 | 29 | 4 | 8 | 82 | 204 | 234 | .539 | 5 | 30 | 90 | 34 | 1 | 3 | |
| Providence | 76 | 35 | 35 | 3 | 3 | 76 | 197 | 242 | .500 | 7 | 28 | 84 | 32 | 3 | 1 | |
| Springfield | 76 | 33 | 38 | 2 | 3 | 71 | 221 | 243 | .467 | 6 | 27 | 79 | 31 | 2 | 2 | |
| Bridgeport | 76 | 27 | 38 | 4 | 7 | 65 | 203 | 254 | .428 | 4 | 23 | 73 | 27 | 3 | 1 | |
| EAST | GP | W | L | OTL | SOL | PTS | GF | GA | Pct | SOW | ROW | Max Pts | Max ROW | HR | AR | |
| z-W-B/Scranton | 76 | 55 | 20 | 0 | 1 | 111 | 247 | 174 | .730 | 7 | 48 | 119 | 52 | 2 | 2 | |
| x-Hershey | 77 | 45 | 24 | 3 | 5 | 98 | 250 | 205 | .636 | 3 | 42 | 104 | 45 | 2 | 1 | |
| x-Charlotte | 77 | 42 | 26 | 2 | 7 | 93 | 255 | 235 | .604 | 5 | 37 | 99 | 40 | 3 | 0 | |
| Norfolk | 75 | 37 | 24 | 8 | 6 | 88 | 246 | 213 | .587 | 5 | 32 | 98 | 37 | 0 | 5 | |
| Binghamton | 76 | 40 | 29 | 3 | 4 | 87 | 246 | 213 | .572 | 1 | 39 | 95 | 43 | 2 | 2 | |
| Syracuse | 76 | 32 | 37 | 3 | 4 | 71 | 200 | 236 | .467 | 2 | 30 | 79 | 34 | 3 | 1 | |
| Albany | 75 | 31 | 39 | 1 | 4 | 67 | 208 | 264 | .447 | 5 | 26 | 77 | 31 | 2 | 3 | |
| Adirondack | 75 | 28 | 37 | 4 | 6 | 66 | 182 | 238 | .440 | 4 | 24 | 76 | 29 | 2 | 3 | |
| NORTH | GP | W | L | OTL | SOL | PTS | GF | GA | Pct | SOW | ROW | Max Pts | Max ROW | HR | AR | |
| Hamilton | 76 | 41 | 26 | 2 | 7 | 91 | 215 | 187 | .599 | 6 | 35 | 99 | 39 | 0 | 4 | |
| Manitoba | 77 | 42 | 28 | 1 | 6 | 91 | 213 | 199 | .591 | 9 | 33 | 97 | 36 | 2 | 1 | |
| Lake Erie | 76 | 41 | 27 | 3 | 5 | 90 | 210 | 196 | .592 | 4 | 37 | 98 | 41 | 2 | 2 | |
| Abbotsford | 75 | 36 | 29 | 4 | 6 | 82 | 178 | 201 | .547 | 11 | 25 | 92 | 30 | 2 | 3 | |
| Toronto | 76 | 35 | 30 | 1 | 10 | 81 | 212 | 208 | .533 | 6 | 29 | 89 | 33 | 3 | 1 | |
| Grand Rapids | 76 | 35 | 31 | 2 | 8 | 80 | 222 | 239 | .526 | 5 | 30 | 88 | 34 | 1 | 3 | |
| Rochester | 76 | 31 | 36 | 5 | 4 | 71 | 207 | 245 | .467 | 5 | 26 | 79 | 30 | 2 | 2 | |
| WEST | GP | W | L | OTL | SOL | PTS | GF | GA | Pct | SOW | ROW | Max Pts | Max ROW | HR | AR | |
| x-Milwaukee | 75 | 42 | 19 | 6 | 8 | 98 | 212 | 181 | .653 | 8 | 34 | 108 | 39 | 4 | 1 | |
| x-Houston | 79 | 45 | 28 | 1 | 5 | 96 | 234 | 209 | .608 | 10 | 35 | 98 | 36 | 1 | 0 | |
| Texas | 75 | 40 | 25 | 4 | 6 | 90 | 207 | 197 | .600 | 6 | 34 | 100 | 39 | 2 | 3 | |
| Oklahoma City | 77 | 38 | 28 | 2 | 9 | 87 | 233 | 226 | .565 | 5 | 33 | 93 | 36 | 0 | 3 | |
| Peoria | 76 | 39 | 29 | 3 | 5 | 86 | 208 | 207 | .566 | 6 | 33 | 94 | 37 | 3 | 1 | |
| Chicago | 77 | 38 | 29 | 4 | 6 | 86 | 249 | 249 | .558 | 6 | 32 | 92 | 35 | 2 | 1 | |
| San Antonio | 76 | 39 | 30 | 4 | 3 | 85 | 220 | 229 | .559 | 7 | 32 | 93 | 36 | 3 | 1 | |
| Rockford | 75 | 33 | 33 | 4 | 5 | 75 | 194 | 234 | .500 | 4 | 29 | 85 | 34 | 2 | 3 | |
| Today’s Games: Manitoba at Toronto – 1:00 PM EDT Portland at Connecticut – 3:00 PM EDT W-B/Scranton at Syracuse – 3:00 PM EDT Binghamton at Albany – 4:00 PM EDT Worcester at Providence – 4:05 PM EDT Peoria at Milwaukee – 5:00 PM CDT Rockford at Texas – 5:00 PM CDT Yesterday’s Results: |
x – clinched playoff berth y – clinched division title z – clinched regular-season title GP – games played W – wins (2 points) L – regulation losses (0 points) OTL – overtime losses (1 point) SOL – shootout losses (1 point) PTS – points GF – goals for GA – goals against Pct – points percentage SOW – shootout wins ROW – regulation/overtime wins Max Pts – maximum possible points Max ROW – maximum possible reg/OT wins HR – home games remaining AR – away games remaining |
Sunday’s Clinching Scenarios:
| Binghamton clinches a playoff berth on Sunday with: | |
 |
(a) a win at Albany AND a Worcester loss (reg/OT/SO) at Providence, OR |
| (b) a point at Albany AND a Worcester regulation loss at Providence | |
| Manitoba clinches a playoff berth on Sunday with: | |
 |
(a) a point at Toronto |
| Milwaukee clinches the West Division title on Sunday with: | |
 |
(a) a win vs. Peoria AND a Texas loss (reg/OT/SO) vs. Rockford, OR |
| (b) a point vs. Peoria AND a Texas regulation loss vs. Rockford | |
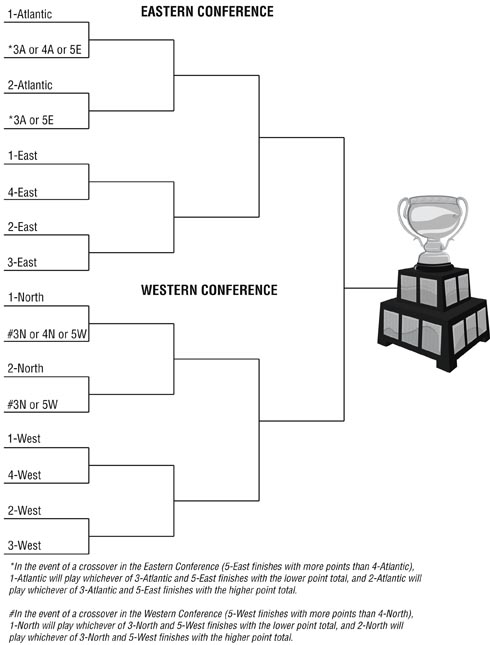
Matchups if the Calder Cup Playoffs started today:
| A1 A3 |
] |  |
|
| A2 E5 |
] | ||
| E1 E4 |
] | ||
| E2 E3 |
] | ||
| N1 W5 |
] | ||
| N2 N3 |
] | ||
| W1 W4 |
] | ||
| W2 W3 |
] | ||
Tiebreaker Notes:
|
|||
2011 Calder Cup Playoffs Qualification Rules:
In 2010-11, the AHL will have 16 teams participating in the postseason.
In each division, the fourth-place team will play the first-place team in the division semifinals, while the second-place team plays the third-place team.
There are two possible exceptions to the qualification rules in 2010-11: in each conference, if the fifth-place team in the eight-team division finishes with more points than the fourth-place team in the seven-team division, it would cross over and compete in the seven-team division’s playoffs.
(If the fifth-place team in the eight-team division produces more points than the third-place team in the seven-team division, then the team that finishes first in the seven-team division shall play the team that finishes third in the seven-team division.)
Division semifinal winners face off in the division finals. The winner of the East Division final plays the winner of the Atlantic Division final in the Eastern Conference final, while the winner of the North Division final plays the winner of the West Division final in the Western Conference final. Conference final winners meet in the Calder Cup Finals.
All series are in a best-of-seven format.
Following are the tiebreaking procedures used in the event of a tie in the standings following the completion of the regular season. (Prior to the end of the regular season, the team with fewer games played is ranked higher in the event of a tie in points.) When a tie among three or more teams is broken resulting in a two-team tie, the original tiebreaking method is used.
Between two teams:
a) wins (excluding shootouts)
b) points in season series between teams
c) goal differential
d) goals scored in season series between teams
e) intra-conference points percentage
Among three or more teams:
a) wins (excluding shootouts)
b) points percentage in combined season series
c) goal differential
d) goal differential in combined season series
e) intra-conference points percentage